

Relying on Unpinned Responsive Search Ads (RSAs) is a Numbers Game You Are Almost Guaranteed to Lose
How long do you think it takes to complete an ad test when you “feed the machine” with the maximum number of available assets? What if I told you it could take over 1,000 years to get an answer you can rely on?
Before we get to that, let’s back up a little, so I can tell you the story of an account I was looking at last quarter. It was a B2B, mid-market e-Commerce account with spend in the 250k-500k range. As part of my audit, I wanted to get a feel for what they were testing. Like many other companies, they were leveraging RSAs with 15 headlines and 4 descriptions pretty much everywhere, but they had what I felt was a good amount of monthly impressions on both branded and non-brand, and so I initially felt that there was enough volume to justify the approach. I was excited to dig in and see what was working and what to do next.
After reviewing a number of the headlines and descriptions being run, I was having some difficulty in understanding what was being tested. There were appeals to convenience, shipping, price, variety, authority, and more all within the same RSA on top of keyword anchors and various calls-to-action. Eventually, my analysis frustrated, I decided to at least determine what the single best ad combination was to use as a baseline, starting with some of the higher traffic ad groups.
However, when I began looking at the ad combinations reports in several high traffic ad groups, and noticed that the “top combination” ads only had single-digit impression percentage delivery, I was troubled. I tried to parse it out by looking at the data month-by-month, cross-referencing the individual assets in the assets performance report. But what I found is that the same headline shown by one report to be a top-delivered asset and integral part of the winning ad combination, when viewed a month later, reported drastically differing results. I felt like I had no solid ground to stand on when it came to capturing the control ad for the next ad test recommendation.
Frustrated by this lack of clarity, I thought back to the “old school way” of A/B ad testing, back from the ETA era and even before from direct marketing. I decided to run some numbers, and I realized that with the current “assetmaxxing” approach, it would take 3,760 years to produce a single, statistically valid result for clickthrough rate improvement alone, and much longer for a conversion-based KPI.
This was something that the team previously managing the account either did not realize or did not believe in. Another issue is that even if they did resolve that test to confidence, if calls-to-action, benefit statements, offers, and keyword relevance anchors are allowed to appear (or not) in any headline position in the wild, that is, the search results page, what could be learned and used from the outcome of such a “test” anyway?
We inherited a never-ending test that we couldn’t use. There had to be a better way.

To Pin or Not to Pin, that is the Question!
There’s this whole debate in PPC about whether you should pin ad assets or leave them unpinned. The argument for leaving them unpinned is that the algorithm will figure it out and deliver the best ad for each user at auction time. Some proponents of this approach point to the fact that Google uses a multi-armed bandit algorithm and proprietary signals that advertisers don’t have access to make these decisions, and therefore: a) they can be trusted to get things directionally correct at scale and b) they can’t be replicated by an advertiser acting without all of that information. In this situation, impression delivery follows something like predicted CTR, and allows ads to be presented to the user without the need for reaching statistical significance.
Therefore, what I call “assetmaxxing” is what you’ll see Google recommend in official documentation, or what a Google rep will tell you on a call. You will find droves of “unpinned” advocates on LinkedIn and X posts highlighting the correctness of the strategy. Because of that, going unpinned has become the default practice over the last 10 years. “Don’t worry. Let the machine figure it out!” It’s easy to think of the algorithm as a magical black box that will always produce the optimal result for us, allowing us to worry about other things, especially if we believe we can’t compete with it, anyway.
Some people may even think of leaving ad sets unpinned as an ideological choice. People can start dividing themselves into camps as Pinners and Non-Pinners. But thinking about it as an ideology also carries this element of faith with it. The problem is that pinning has nothing to do with faith. At the end of the day, you have to contend with a math problem. One that may ultimately be unwinnable without pinning.
Pros / Cons of Pinning
Pros
- ✓Greater control of what’s being tested
- ✓Faster results because of fewer possible ad combinations
- ✓Greater chance of more precise ROI
- ✓Allows Google to test what really matters
- ✓Works with accounts of any size
- ✓Improved understanding of why winners win
Cons
- ✕Might miss out on a winning combination (the “what if”)
Pros / Cons of Unpinning
Pros
- ✓Less work for you by leaving combinations up to the algorithm
- ✓Could alert you to fruitful potential combinations you didn’t notice before
Cons
- ✕Could take impractically long to reach statistical significance
- ✕Inability to know which ad combinations served for which queries
- ✕Delivering irrelevant or misleading results to searchers
- ✕Looser understanding of why the winning combination won (multi-variate testing causality conundrum)
- ✕Opportunity cost of serving an ad with worse performance in the KPI you care about
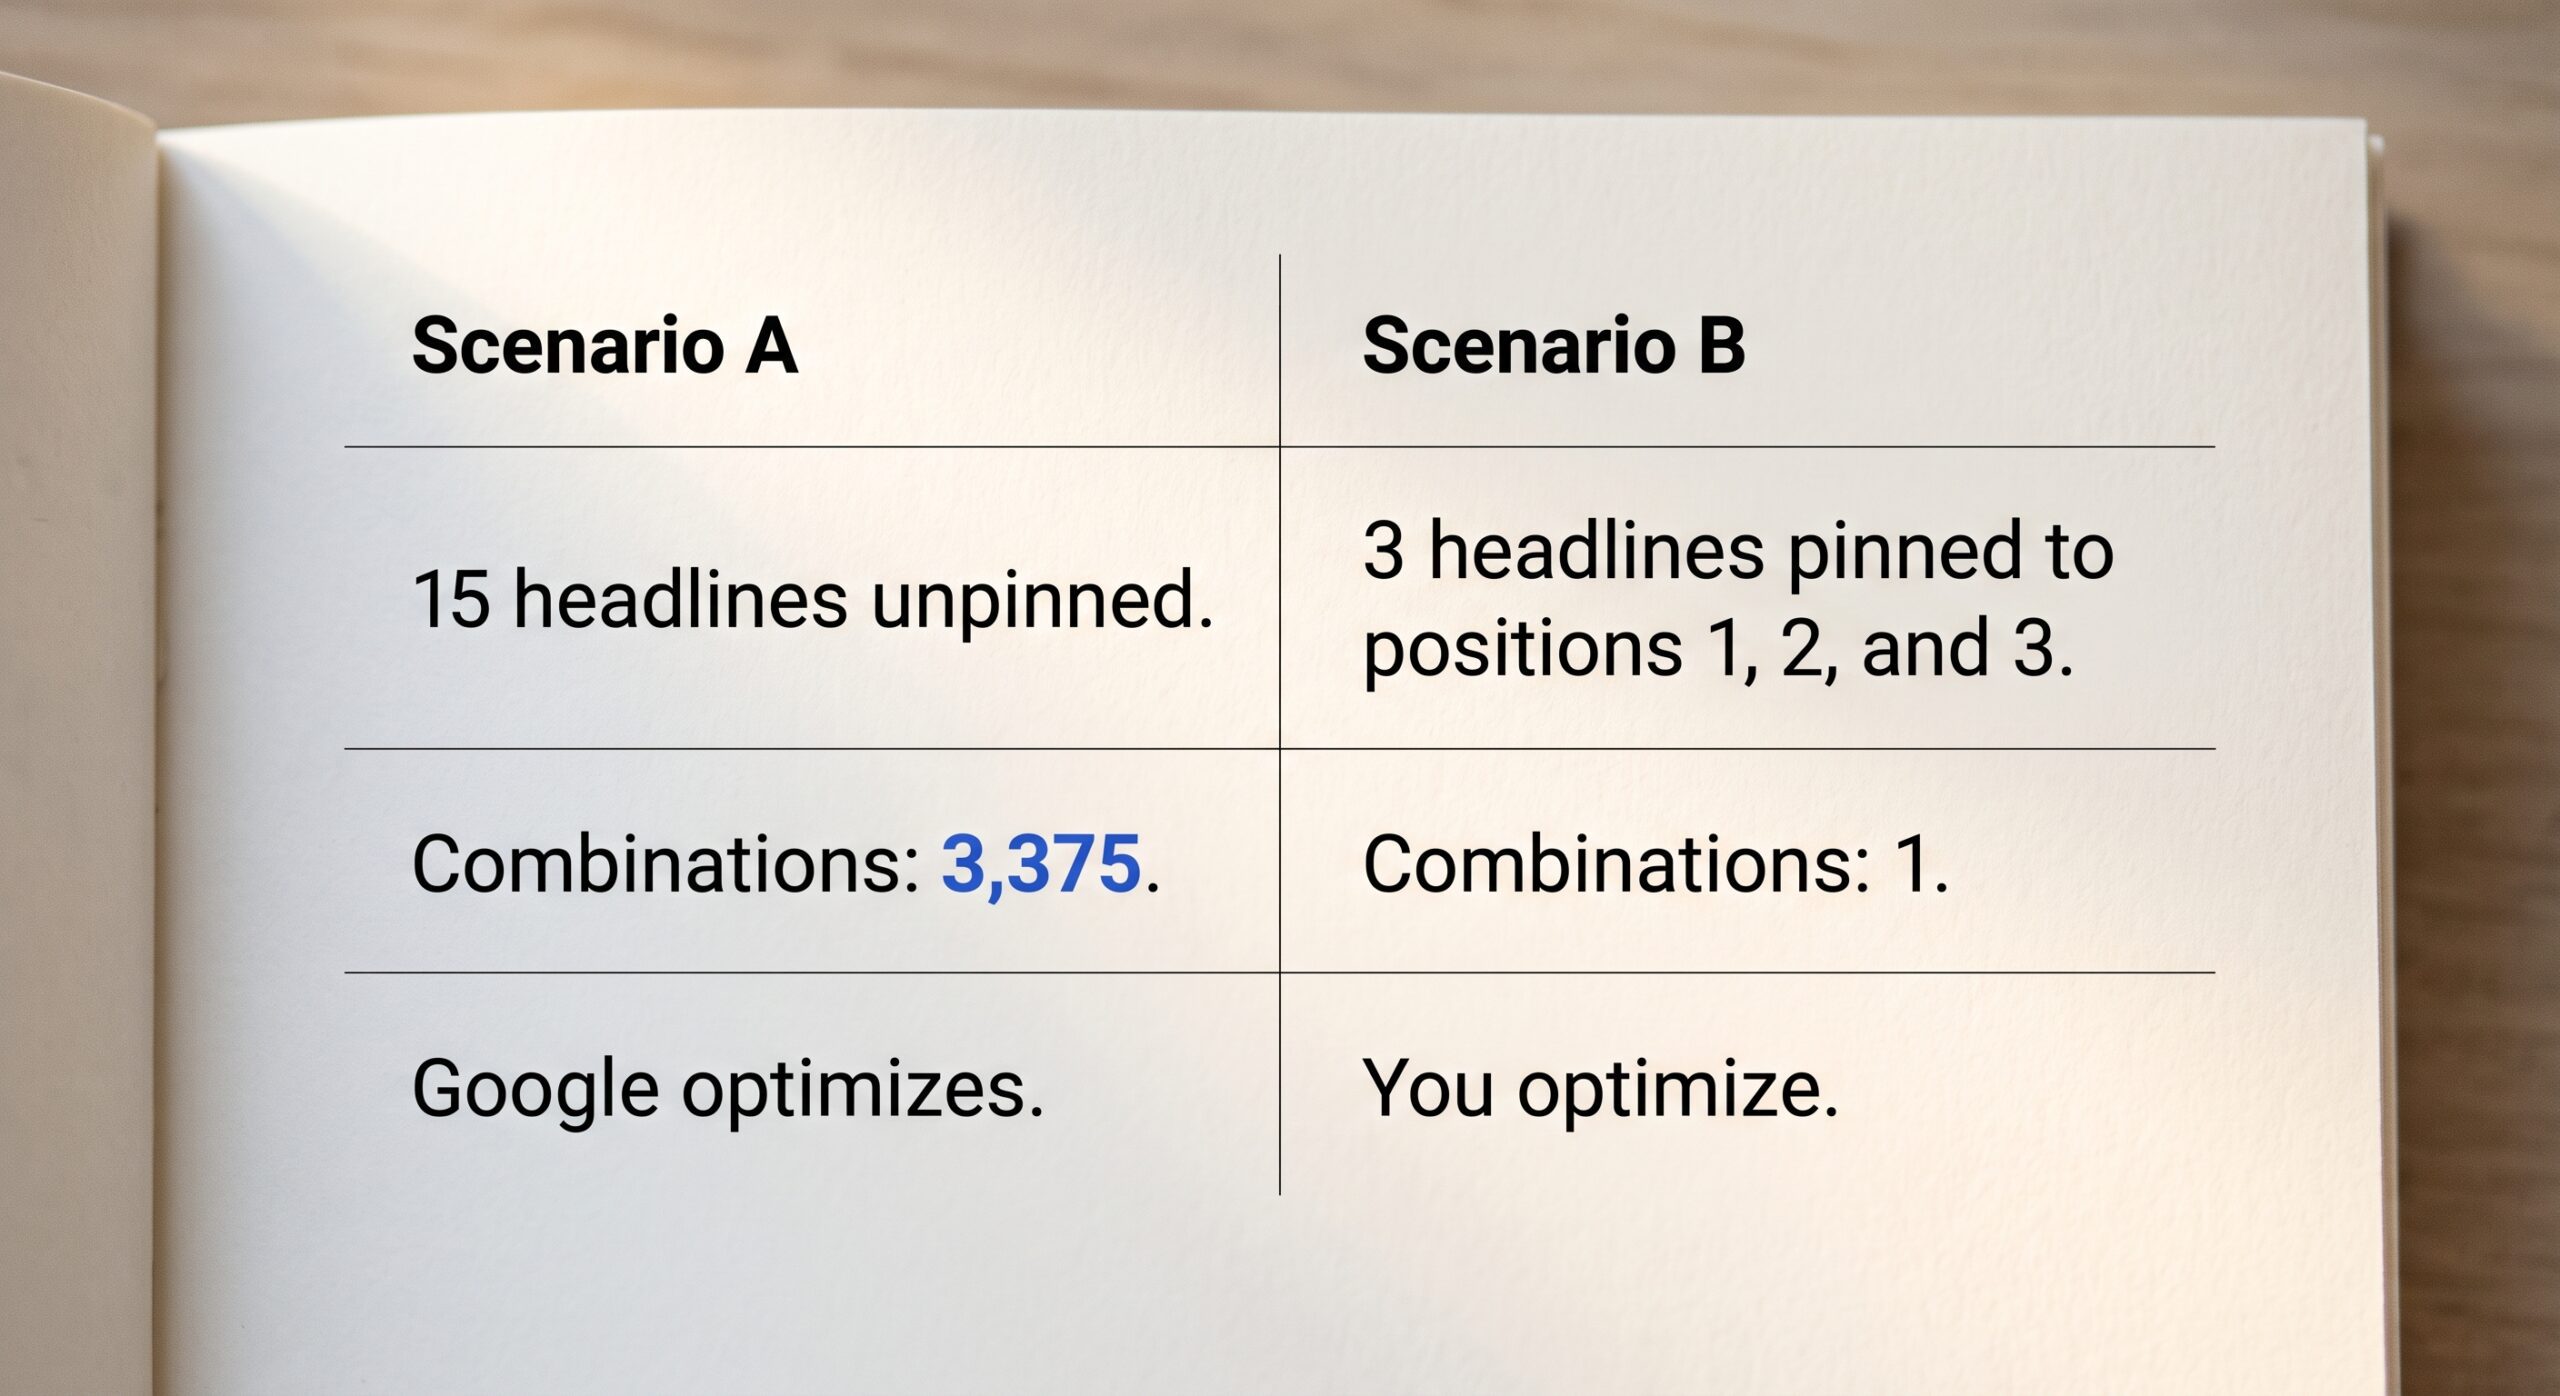
Google’s Pinning Guidance Creates Collapsed Structures That Can Dilute Performance
Before we get into the nitty gritty, let’s talk more about Google’s official guidance on pinning. Their advice in their official documentation, and echoed by many reps, is that you should feed RSAs with as much asset variety and quantity as possible, then let the algorithm (increasingly, they are referring to this as “Gemini” or “Google’s AI”) sort it out. Outside of having too many concurrent variables changing during testing, this approach also leads to accounts with collapsed structure (fewer campaigns, ad groups & keywords) and degraded keyword-to-copy-to-landing-page congruence. Let me explain what I mean.
While on the surface it sounds plausible that providing more headlines and descriptions in each ad gives you more testing, and therefore more chances to win, in practice (and by the numbers I’ll share shortly), the account can start devolving into mismatches between keyword impression and asset impressions, leading to decreased efficiency in the way of decreased clickthrough rates and conversion rates. It fundamentally violates the principle of relevance that search advertising was originally founded upon.

Assetmaxxing + Collapsed Structures = Diminishing Returns
This account I was looking at had a pretty collapsed structure compared to how it was built in the past. Based on the change history logs, the account changed hands over several agencies in a span of just over a decade, and while the oldest managers seemed to favor deep segmentation with high traffic single keyword ad groups (SKAGs) and single theme ad groups (STAGs), the newer campaigns were consolidated into just a handful of campaigns with heavy use of broad match and ad groups containing up to dozens of keywords.
One interesting finding was that the current iteration had what might be considered their most important non-brand keyword isolated in its own campaign and ad group, with one responsive search ad. And here, as with elsewhere in the account, they used the strategy I earlier called assetmaxxing, which is the practice of incorporating as many unpinned headlines and unpinned descriptions as possible. A lot of people are into assetmaxxing, and I was once, too. (This is also when I thought ad strength mattered, but that’s another conversation for another day.)
It turned out that the same basic RSA (the same set of headlines and descriptions) also appeared in all of the other search campaigns and ad groups. As I began to investigate both the search terms reports and the ad combinations reports for various ad groups, the issue started to surface that unoptimized, and sometimes downright nonsensical ad combinations were being shown for a given targeting topic. Each time that happened, a little efficiency was lost, because the tight connection between what was being searched by the user, what was being said in the ad and which landing page the user was directed to was incongruent.
The symptom that I noticed that became the diagnostic and part of the insight that led me to this new understanding of pinning in ad testing is that among the targeted keywords within the same high traffic ad group, there was significant variance in the “ad relevance” scores. There were pockets of keywords with “above average”, some “average” and many “below average”. Many of the highest impression volume keywords in ad groups analyzed were “below average”.
Going a layer deeper to the search terms report, in light of the broad match types being used, it was clear that the variety of queries and their semantic distance from the keywords actually targeted further exacerbated the issue. How could you design or trust an ad test when the queries the ads were being shown for were so heterogeneous? How could you ever know why a winning ad wins, and design the next experiment?
This “pseudo-testing” problem gripped me straightaway, and I realized that it’s made worse by the fact that Google Ads never reports to advertisers which specific ad combinations or assets are shown for which specific queries! If you want to get close to even approximating this, you need to take matters into your own hands.
At the end of the day, if you don’t know what is really winning or why, how can you possibly scale what’s working or improve your performance in a rational manner? You can’t, because the alternative is that as you scale, the inefficiency scales with you, and the only one who profits from that is Google.

The Math of Assetmaxxing
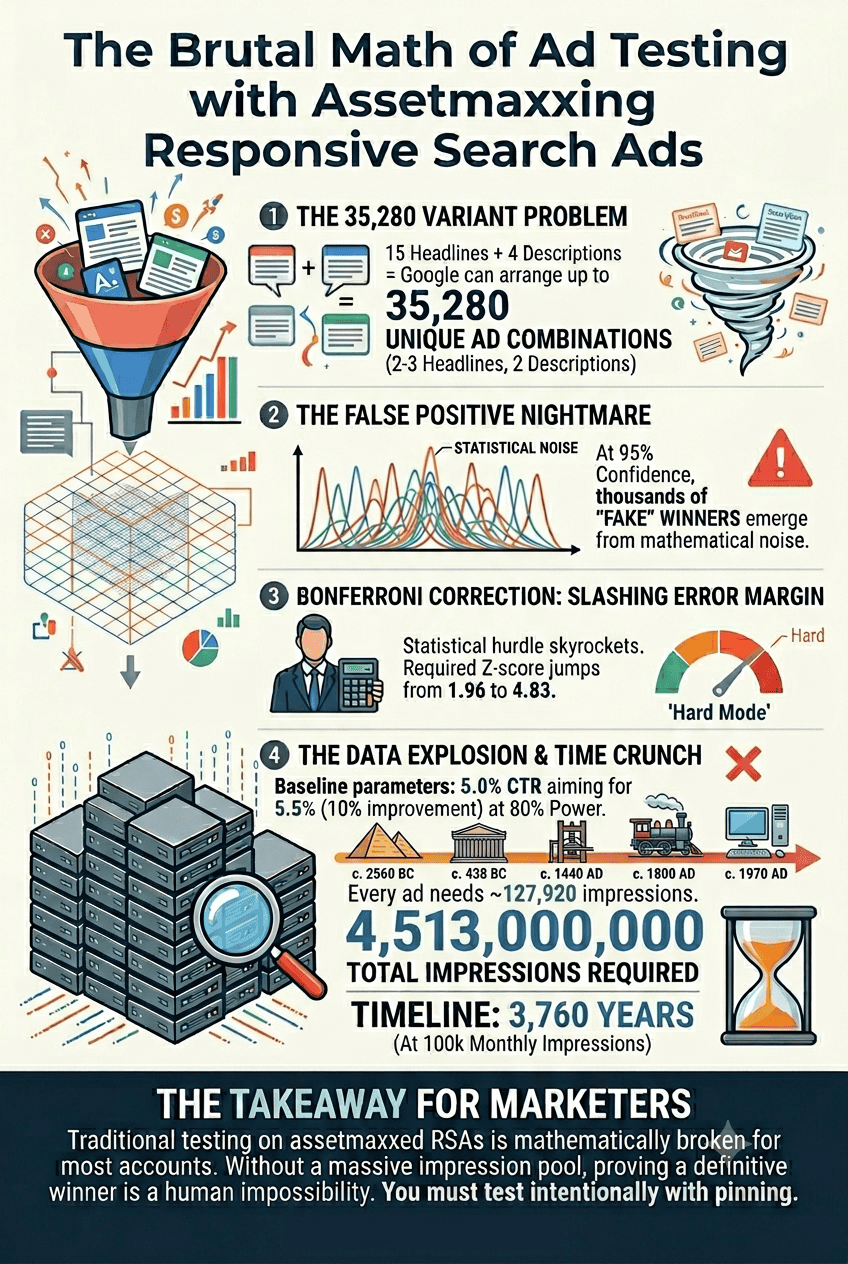
There were two specific conditions that led to the conclusion of the millennia-long ad test in this ad account. The first is that if you fully maximize your RSA assets with 15 headlines and 4 descriptions, Google can generate up to 35,280 unique ad combinations (and maybe more, when you factor in additional assets and formats).
Second, this account which has decent volume was generating over 100,000 search impressions per month which is a drop in the bucket when you consider that approximately 4.5 billion impressions are needed to resolve a CTR test with a 10% or higher desired baseline improvement at 95% statistical significance with this number of assets (“variables”) in play.
Unless you are a top 1% advertiser in terms of monthly spend or your brand plans to outlast the ancient Pharaohs, a Frequentist multi-variant test on an unpinned RSA remains completely impossible.
The Brutal Math of Testing Every RSA Combination (CTR Edition)
If you treat a single Responsive Search Ad (RSA) as a classic, clinical A/B/n test to mathematically prove which specific asset combination yields the absolute highest Click-Through Rate (CTR), the numbers get terrifying very quickly.
Here is what happens when you pit all possible variations against each other under standard scientific testing conditions:
- The 35,280 Variant Problem: With 15 headlines and 4 descriptions, Google can arrange your assets into 35,280 unique ad combinations (factoring in 2-headline, 3-headline, and 2-description permutations).
- The False Positive Nightmare: If you test 35,280 variations at a standard 95% confidence level, random mathematical noise guarantees you will find hundreds of “fake” winners.
- The Bonferroni Correction: To eliminate these false positives, statisticians apply a correction that slashes your acceptable error margin per ad. This forces the required statistical Z-score to skyrocket from a standard 1.96 up to a brutal 4.83.
- The Baseline Parameters: Assuming a healthy account baseline CTR of 5.0% and aiming to detect a realistic 10% improvement (targeting a 5.5% CTR) with 80% statistical power, the required data pool explodes.
- 127,920 Impressions Per Ad: Because the statistical hurdle is so high, every single one of your 35,280 combinations must individually receive roughly 127,920 impressions to prove a winner.
- The 4.5 Billion Impression Threshold: Multiplying those impressions by your total combinations means your account needs to accumulate a staggering 4,513,000,000 (4.51 billion) total search impressions for this single ad test.
- The 3,760-Year Timeline: If your account generates a highly respectable 100,000 search impressions per month (1.2 million per year), it will take exactly 3,760 years to mathematically declare the single best headline and description combination.
Unless you are a top 1% advertiser in terms of monthly spend or your brand plans to outlast the ancient Pharaohs, a Frequentist multi-variant test on an unpinned RSA remains completely impossible.
The Takeaway for Marketers
This is why running a strict Frequentist A/B test inside a standard RSA is a human impossibility. To survive in modern search engine marketing, you have to abandon traditional testing frameworks and trust Google’s machine-learning “multi-armed bandit” algorithms or use asset pinning to aggressively cut down your total asset permutations.
How Can You Assetmaxx with Unclear Asset Performance?
However, it wasn’t even the math that got to me the most, it was the asset performance data. To get the contours of what’s working on a broad level, I like to look at the performance of individual assets. There was one headline in particular that appeared to be moving the most freight. Key word: appeared. Digging in deeper, I realized that the results were fluctuating significantly from month to month. In January, it was producing 0.70 in revenue per impression, but in February, it was garnering 6.82 per impression. It was the same copy, just a different month, but Google had also chosen to show other assets alongside the same headline which significantly influenced its performance.
In this space of thousands of possible combinations, the headline didn’t change at all. Still, I’m sure the existing agency was looking at asset performance, trying to make decisions about the headlines to keep or cut, and made what may have been a poor decision thanks to limited, noisy, unreadable data.
Following the Mirage of the “Best Combination” Can Lead to Ruin
I like to think of this as a mirage, something that has also called to me in the past. You’re picking up on a signal that doesn’t actually exist. When you find yourself in this situation, it’s easy to go down the wrong path, because, like I mentioned, the wrong path is what Google suggests, what most blog posts repeat, and what most reps will tell you.
They’ll tell you “Don’t pin! You could be missing out on opportunities! Google has dozens of signals that you don’t! Constraining the system can limit Google’s ability to find the best combinations!”
I get it. The argument sounds completely logical. Why do we think we’re better than machine learning? And I would say that the argument is at least half-right. Google does have some proprietary black box secret information they can use to fine-tune our RSAs, and it can be genuinely sophisticated. However, it’s built on this grand assumption that your account will have the requisite conversion volume to feed this machine, which might be true in the minority of cases.
For everyone else in the majority? 90 percent or more of advertisers? No way. The volume isn’t there and it will never be there to make sense to unpin everything. And even if you do clear the bar on raw impression or conversion volume to resolve such a test to significance, the ad combinations report provides results in terms of impressions delivered, giving the advertiser little confidence that that specific combination out of 35,280 possible ones is the one that led to the statistically significant lift in the KPI you most value.
The bottom line
To Put it Simply: Following Google’s Official Guidance is Structurally Wrong for Almost Everyone
It’s almost maddening that nobody is saying this out loud, but I hope I’ve proven to you that math is not on your side. It’s like walking into the casino every day for decades and continuing to put money into the slots. Maybe you make enough to break even and keep playing, or you’re “slightly ahead”, but at the end of the day the house always wins. If you’re with me, and you take this argument seriously, I want to encourage you to reframe your question. Instead of asking yourself, “to pin or not to pin?” Instead, ask, “How much signal does my account actually produce, and what test can I run with that?”
Can your account actually read an ad test?
Methodology & assumptions+
(P(H,2) + P(H,3)) × P(D,2). With 15 headlines and 4 descriptions that is 35,280 — before images. Image and video assets multiply this as an upper bound; in Search they serve in only a subset of auctions, so for pure text testing the text figure is the binding constraint.95% confidence and 80% power. Testing many variants at once produces false winners, so the confidence threshold is Bonferroni-corrected across the number of variants compared (this is what pushes the required Z-score from 1.96 toward roughly 4.8 when you test the full space).variants × per-variant sample in exposure units (impressions for CTR, CPI and RPI; clicks for CVR). “Concludable” means the read completes within an 84-day (12-week) window before seasonality corrupts it.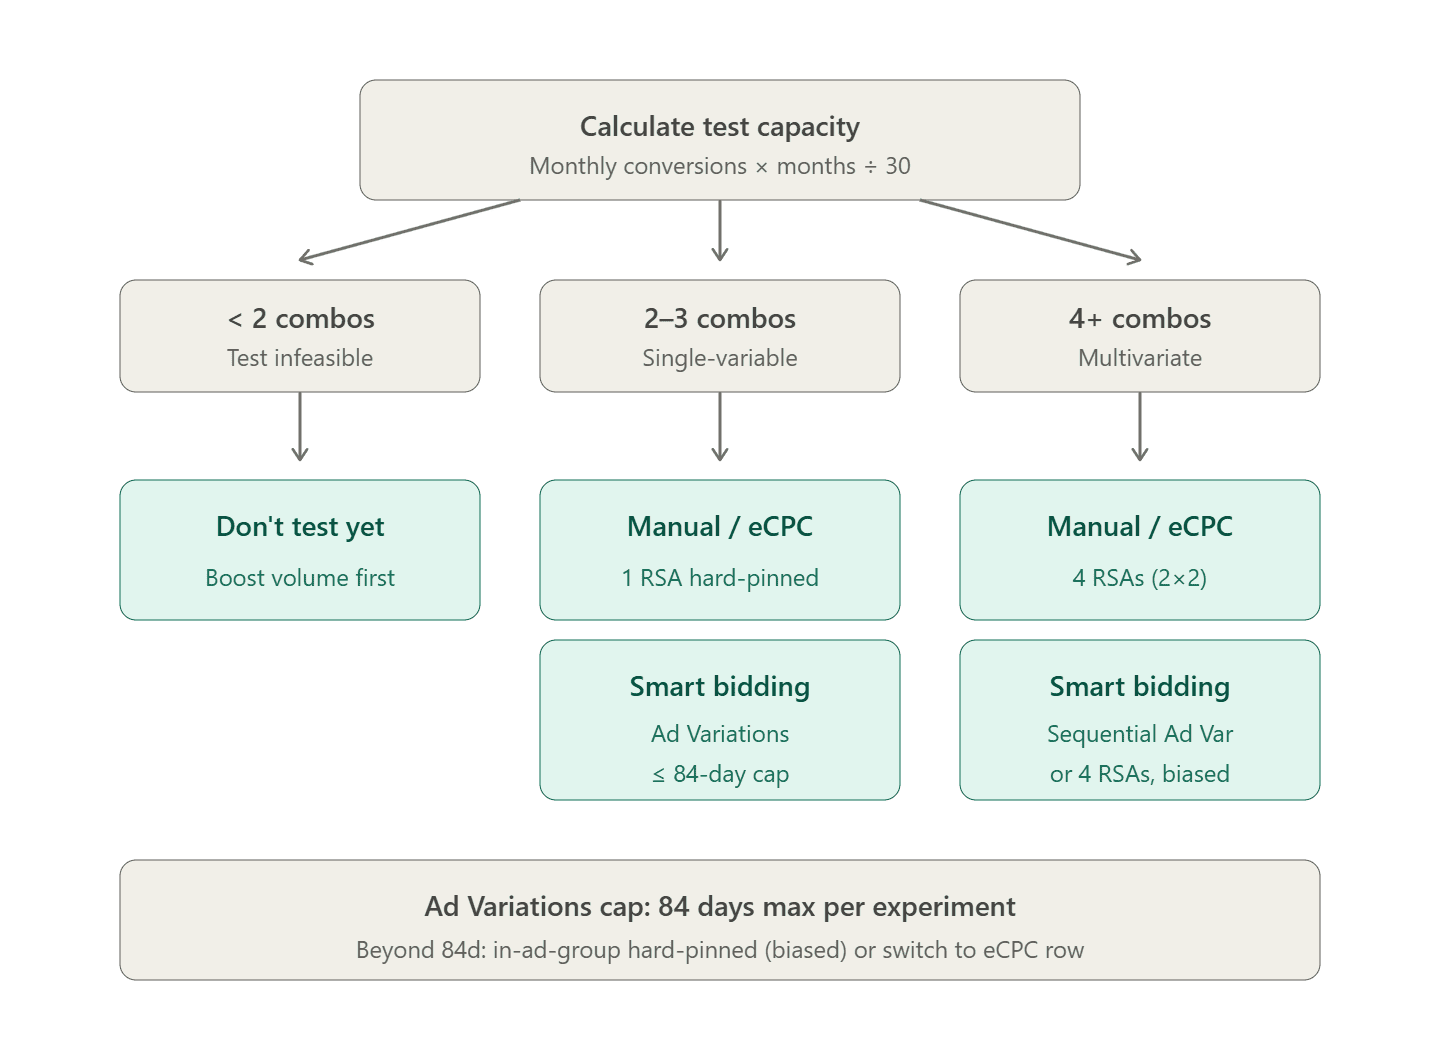
The Good News? The Math for a Winning Combination is Pretty Simple.
By the way, to simplify things, I’m assuming that you care about a conversion-based outcome such as revenue per impression (RPI), conversions per impression (CPI), conversion rate, or similar. Here’s what you’re going to do instead of leaving everything unpinned:
- Start With Monthly Conversions in Testing Ad Groups: Take your monthly conversions in any ad groups you’re testing and multiply them by the number of months you’re willing to run the tests. Take that number and divide by 30. You’ll get the maximum number of asset combinations you can resolve to standard statistical significance during the test window.
- Reverse-Engineer Your Test: From there, it’s just a matter of reverse engineering. If you can’t get the number above 2, it’s not time to test. Find a way to get more volume, either through additional targeting, adding slightly broader match types, adding budget, or exploring different networks. It might even be a matter of working on your back-end to increase the conversion rate from leads to customers or increase the lifetime value of a lead first. If you’re totally stuck, you could try a longer testing window, or test on a different KPI like CTR.
- Running a Single-Variable or Multivariate Test: Once you get to a 2 or a 3, you can run a single variable test. This would be a hard-pinned RSA, where you’re really forcing Google’s hand in what you’ll allow to be tested. If the number is 4 or more, you can start running multivariate tests with multiple RSAs. This might look like one headline position, one display URL, one final URL, one description position, and so on.
Remember: Hope is Not a Strategy
At the end of the day, your discipline should be that your ad architecture follows your capacity to test variables, not the other way around. Where most accounts go wrong is they get this all backwards. They think about what they want to test and then hope they get enough volume to process meaningful results. Unfortunately, hope is not a strategy.
The best way to test is to start by figuring out what you can read and then designing the test to fit. That’s the work. That’s the strategy.
Pinner, Non-Pinner, or Recovering Assetmaxxer?
Run your numbers in the calculator above, then tell me what it said: how many variants can your account actually read, and does that change how you’ll build your next RSA? Drop your result, your objections, or your own 3,760-year story in the comments. I read every one.
Struggling to Figure Out What to Test First? We can help you solve the math problem and move forward with signals you can actually use: let’s talk.