

Ad testing is an essential aspect of campaign management, and one of the primary ways to improve performance in pay-per-click advertising.
It cannot be done haphazardly, and, contrary to popular belief and common advice, assetmaxxing is not a valid testing strategy. The “smart bidding story” put forth by big tech platforms often breaks when confronted with the constraints of reality, privacy, and technology. Blindly trusting an unauditable machine algorithm for short-term gains deprives you of one of the most valuable assets in marketing: understanding why an ad wins for a specific audience.
So what, then, is to be done about it? We need to greatly simplify things, ground our approach in the realities of math, carefully design tests with a real shot at success, and implement them in a manner that supports their validity.
At its core, successful ad testing is all about conducting tests in a scientific manner to achieve a statistically valid result we can be confident in and learn from.

Step One: Segment to Simplify
The first thing we are going to do is to simplify by creating testing groups. Think of it as segmenting your campaigns by the type of messaging being utilized. Here’s how to define a testing group: each customer journey stage, style of targeting, or unique placement or format combination should be in its own group.
For example, you might have a brand search group, a competitor search group, a non-brand search group, a “short vertical video” awareness group, and a display retargeting group.
CRITICAL RULE: Creatives must only be evaluated against peers within their specific testing group. Never cross-pollinate winning assets from one testing group to another with the assumption that performance will hold. A headline that wins in a high-intent Brand Search group may fail entirely in a Display Retargeting group because of the psychological context the user is in when your ad reaches them.
Step Two: Calculate What Test You Can Run
Next, it’s time to do the math. How many conversions per month do you receive within each testing group? As a baseline rule of thumb to even consider testing, you’ll need at least 60 conversions to resolve one test per month to statistical significance.
However, understand that statistical significance is not just about a set number; it is actually determined by the Minimum Detectable Effect (MDE). If you are testing a minor variable that only produces a 2% lift in performance, 60 conversions will actually not be enough to reach statistical significance. The 60-conversion threshold assumes you are testing macro-variables that will produce a noticeable difference in performance.
If you don’t receive at least 60 conversions per month in a given test group, then expand your date horizon, first to two months, then to 84 days, then as long as needed. You’ll take the number of conversions in that period, divided by 30, and the result needs to be greater than or equal to 2 in order to start a single variable test when a substantial MDE is expected. As a helpful guide, follow the below chart:
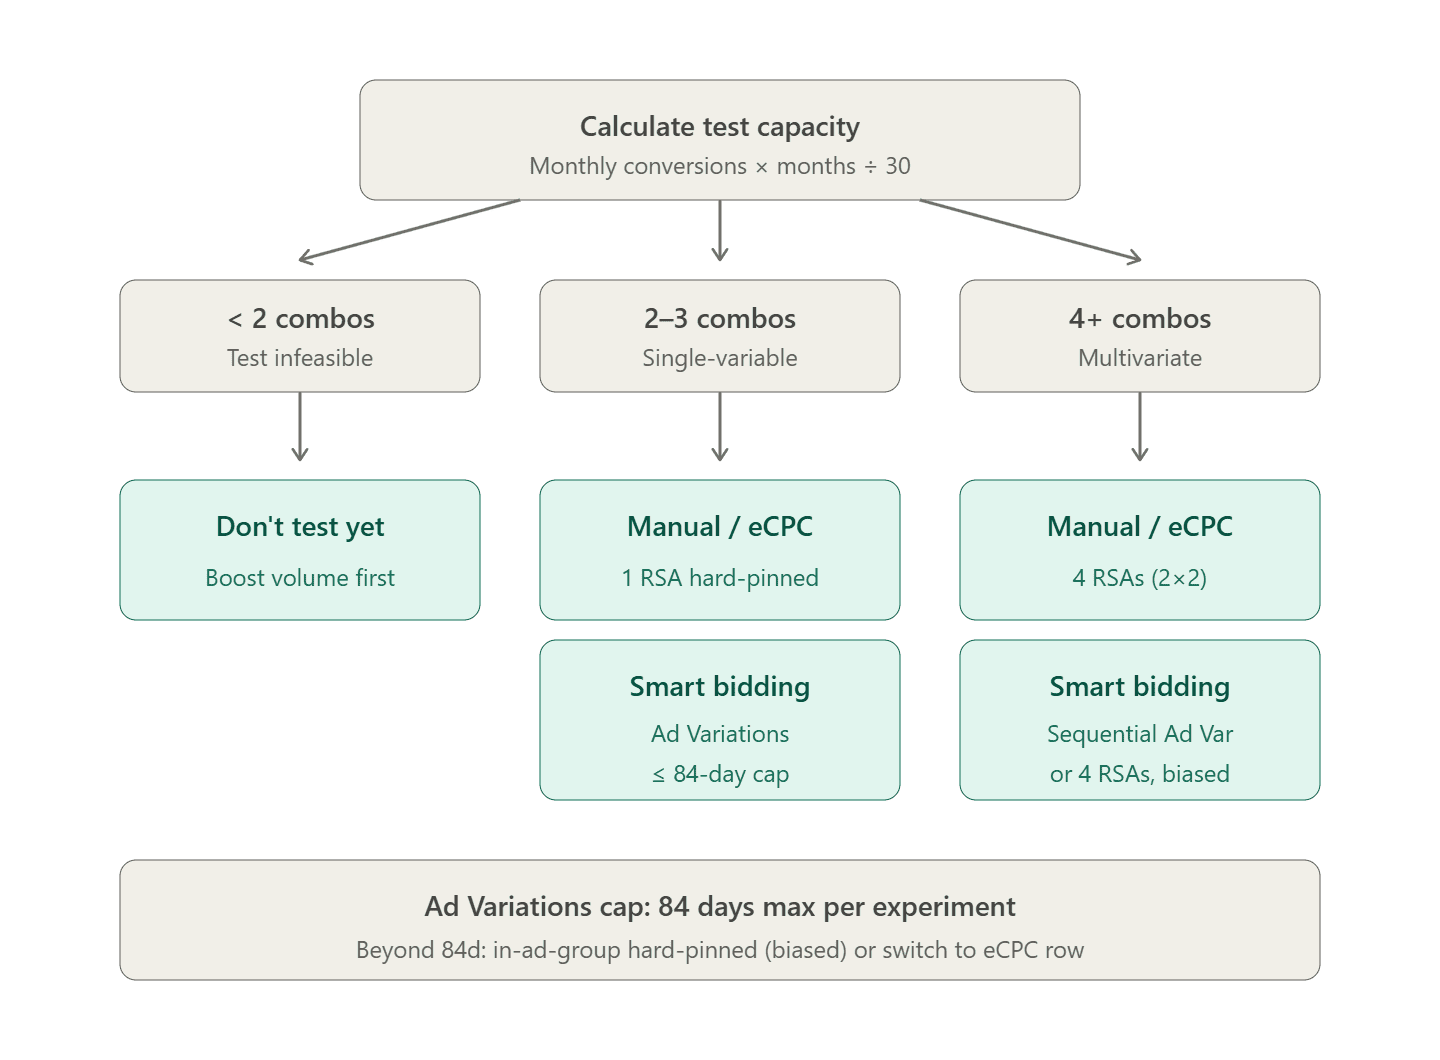
If you’re ultimately falling below the conversion volume thresholds needed, you have three immediate options:
- Consolidate your testing groups to pool more volume together
- Get more volume with additional targeting, higher bids or more budget
- Change the KPI you’re testing for or change the conversion action you’re optimizing for (“micro conversions”)
Step Three: Design a Winning Creative Test
For the third step in the ad testing process, try to determine what variable, if tested, is likeliest to move the performance of your ad the most. Most of the time, the 80/20 aspects of a visible ad will be a headline, an image, or the first few seconds of a video creative. So pick one thing, say the Headline 1, and move on.
In the best case scenario, you’ve already done some market and customer research, or better yet some testing that has provided some clues about what categories of appeals to test that are likely to have a large MDE. Following the advice of the legendary Brad Geddes, “test questions, not copy”.
Examples of great testing questions include things like: “Do returning users respond better to bonuses or discounts?”, “is it more effective to express savings as a relative or absolute figure?” or “does a product feature shot or lifestyle photo increase CTR more?”.
In the beginning of your testing journey, it is advisable to test a variety of messaging types and hooks to find winning approaches before doubling down and testing more specific details within a messaging category. The more you know about your customers’ wants, needs, and psychology, the better questions you can ask. When in doubt, study what your closest competitors are doing, and reflect on how you might differentiate your ads from theirs.
At this point you’ve selected your testing variable and what category of messaging or creative you want to try, and it’s time to generate options and select the one you feel most strongly about to advance into the test. My process typically involves first putting pen to paper and then using generative AI tools to explore even more options.
If you need help brainstorming possible tests and categories of appeals, our Psychological Drivers Swipe File is the perfect resource to get you started! It draws upon our experience and tests from the last 15 years of running pay-per-click campaigns as well as our studies of persuasion, copywriting, influence, and behavioral psychology.
Free download
Psychological Drivers Ad Testing Quickref
Twenty hooks, biases, and persuasion principles, organized the way you test them: primal drivers, cognitive biases, frameworks of influence, and execution-level appeals, each with a ready-to-adapt ad copy example.
Three pages, no fluff. We’ll email you the PDF; unsubscribe anytime.

“What if I’m inheriting an account or just setting up a properly structured ad test for the first time?”
You need to do some setup and craft your control ad. If the account structure is fairly pure—that is, it doesn’t have commingled targeting at the query, keyword, audience, format or network level—then proceed to outline testing groups, and take the next step for each one.
For each testing group, pull a long-term (90 days or longer, provided conversion tracking measurement was sound during that period) assets performance report with columns enabled for: impressions, clicks, cost, conversions, conversion value, asset type. Download it, and then create columns with corresponding formulas to calculate the “north star” KPI values, usually for clickthrough rate (CTR), conversions per impression (CPI), and revenue per impression (RPI).
Depending on how your ads are currently built, you may need to normalize or clean up some of the asset performance report data. Sometimes people have keyword anchor headlines (where H1 always maps to the primary ad group keyword theme), use dynamic keyword insertion, or have slight 1-or-2 character differences in punctuation, pluralization or spelling among various ads that are otherwise replicates of one another.
In these instances I’ll typically conduct a find-and-replace, and occasionally I’ll opt instead to add another column and assign a label to every headline based on its message category (say shipping, availability, social proof, price, authority, etc.) and then pivot out the table before proceeding to calculate the KPI values.
After you have clean data, you’ll want to apply some filters to the resulting table to find the most durable, winning assets that you can utilize as a control in your first test. If you used the labeling approach, you will also have some data about performance by category of appeal.
To illustrate this, if you’re using CPI as your north star key performance indicator, sort the table first by conversions descending and then hunt for assets with outlier CPI values (those that have a value well above the average CPI for the group). Evaluate each asset type against its peers only. For example, evaluate headlines against headlines, and descriptions against descriptions, not headlines against descriptions.
If an asset has dozens of conversions and outlier CPI (again, another way to think of this is 1+ standard deviations above the mean) you can have greater confidence that it will perform well in future tests for similar styles of targeting. Make note of your outliers in your ad testing notebook.
You should now have enough information to build a control ad if you were missing one by combining proven winner assets and can proceed to designing the test.
“What if the account targeting is messy or commingled?”
If the account is consolidated or poorly structured, you will look for directional cues in the overall asset performance to help inform your test hypothesis. You essentially have to accept that your control ad will be imperfect, and potentially brace for performance volatility as you get started.
While I personally feel the benefits of creating structured testing far outweigh the temporary fluctuations, I also acknowledge that you may need to reduce the risk of capsizing while launching this ship out of the harbor. The best thing I’ve found in these cases is to manually dig into each important and high-traffic ad group, dig out the winning combination, and assign control ads more individually.
If I’m being extra cautious, I’ll wait for a period of time to observe the performance of my new control against the historical baseline and make adjustments as needed. When things level out, then I proceed with launching my first true test.
“What about assets with killer CPI scores but low-ish impressions, clicks, or conversions?”
These outliers are frequently the result of selection bias from the algorithm (e.g., serving a specific headline only to highly qualified users). The knee-jerk, rookie mistake is to take these as gold and start using them everywhere when they could be pure randomness or statistical noise.
The better thing to do is to use them as a clue to help you infer the kind of thing you’d like to craft your next hypothesis around.

Step Four: Build Your Ad Test in Google Ads
The next step is to operationally build out the test. Start by filling out your ad testing workbook with the test information, then proceed to build the test in the Google Ads interface using one of the appropriate methods and set a check-in reminder on your calendar.
“What are appropriate ad testing methods?”
- “Best Case Scenario”: For tests you can conclude within 84 days, the gold standard is to utilize the experiments tab, and this is true whether you’re using smart or manual bidding because it ensures a clean 50/50 cookie split and rolls up performance data nicely for review. If you’re conducting a single variable test in search campaigns, use the “variants” experiment type; otherwise, use the custom experiments type for multi-variate or non-search tests. In this situation, hard pin assets in the control ad and use the Experiments’ “find and replace” function to create the test version. (Note: for multivariate responsive search ad (RSA) tests, use the custom experiments type and Google Ads Editor to bulk edit RSAs throughout the test campaign version).
- “Smart & Quick”: For tests you cannot conclude under 84 days when using smart bidding and unwilling or unable to switch to manual bidding, you will conduct your testing within the same RSA by forcing multiple assets to be pinned to the same position. Use this with extreme caution, because this approach has some significant limitations in that it falls victim to algorithmic impression steering. The machine will not distribute impressions evenly, rapidly starving variants it deems weaker, and for that reason it’s worth seriously considering a switch to manual bidding to run a test if you’re expecting a large MDE. If you move ahead anyway, determine what variables you’re testing and how many combinations you can test based on the conversion quantity. It’s a lesser-known fact that you can pin multiple assets to the same ad position (example: three headlines pinned to Headline 2 position). In this case use Google Ads Editor to bulk paste the finalized RSA everywhere in the testing group. At check-in, read the results by comparing performance among the pinned control and test assets across the entire testing group, and note that the ad combinations report is unreliable for this purpose!
- “Second Best Situation”: For tests longer than 84 days and when using or willing to use manual bidding strategies (including Enhanced Cost Per Click) you will default to having two responsive search ads in each ad group: a control ad and a test ad. In this scenario, ensure you have the campaign ad rotation setting configured to rotate indefinitely, and note that Google ignores this setting entirely when a campaign uses smart bidding. You’ll want to hard pin both ads and make sure that only the test variable differs from control; keep everything else the same.
These three approaches make up our standard guidance on ad testing, and hopefully you see how they could be adapted for Performance Max and Demand Generation campaigns as well. (Personally, I’m beginning to favor the unbundled approach to placement and format selection that Demand Gen offers when compared to PMAX, because it allows you to conduct more pure tests. In PMAX asset groups with text and image assets that are delivering across networks, how do you know which headline asset impressions were search and which were display? To my knowledge, you don’t.)
We are aware of additional ad testing methods in popular use which fall outside of the standard guidance, and I will give some treatment to them below:
- High Traffic/Low Traffic Rollover: This is a classic, and something I used going back to the pre-ETA (Expanded Text Ad) era. If you’ve got a lower volume account or testing group that’s going to take impractically long to conclude tests, the HT/LT method conducts testing in higher traffic campaigns and rolls winners across the account including the lower traffic testing groups. While technically lacking, this approach aims to raise the account average performance over time, and although it doesn’t account for ad group level performance differences it is certainly convenient. In modern deployments we highly recommend limiting asset quantity and hard pinning, again to speed up test duration.
- Sequential Testing: When seasonality is a non-factor and conversions tend to flow steadily over time and with similar values, this approach runs a control version of the ad over some fixed duration, after which point the control is paused and a test ad unit is launched while all other factors such as bidding and targeting are held constant. Ideally two distinct ad units are used (versus recycling within the same ad) so that at the conclusion of the test the results read out is much simpler.
- Dirty and Dangerous: This last one is sadly the most common in the wild, and we cover why it’s usually wrong in our post Pinning is a Math Equation, Not An Ideology. Yes, I’m talking about the unpinned Responsive Search, Responsive Display or PMAX ad. Often they are accompanied by a large number of human or AI-generated assets. In the highest traffic campaigns, they can technically work from a statistical point of view, but one of the chief confounds is the shifting sands of targeting. The second you use this with broad match or mixed audience signals, you’ve lost the ability to understand which ad won for which keyword or audience, which in my estimation, is sort of the point. To administer dirty tests of this kind, the most sensible approach I’ve found is to either: a) elimination test with periodic check-ins to calculate and kill loser assets (i.e. “survival of the fittest”) or b) identify winning assets by type (headlines vs. headlines, descriptions vs. descriptions) and build up or reconstruct statistically winning ads in that manner. The purist in me hates this, because the platonic ideal would be to rely on the ad combinations report, but again that only provides a percentage of impressions served within each ad group for the alleged top combination (i.e. top delivered combination) and there’s the additional conundrum of attempting to read results in this manner when the same dirty unpinned assetmaxxed RSA is distributed across many ad groups. I have no words of advice on how to proceed then except to trust fall into the waiting arms of the nearest Google rep and make sure your optiscore stays above 90% while your ad strength is “excellent”.

Step Five: Run & Monitor Tests
Once your test is built in the Google Ads interface using one of the recommended methods for your situation, launch the test.
From this moment forward, you should practice operational discipline. Try not to make any other changes to the ad group or campaign (e.g., altering bids, pausing keywords, or shifting budgets) while the test is active to avoid confounds. Changing the environmental variables mid-flight pollutes the data and completely invalidates your test.
Check in periodically (e.g., once a week) by reviewing the Experiments tab data, or by pulling the data for your two labeled RSAs and running it through an external statistical significance calculator.
As you monitor, adhere strictly to these three unbreakable rules of test administration:
- Rule 1: Meet Data Thresholds First: The primary determinant of a test’s length is not time, but volume. Your test must run until it meets the conversion or click thresholds required by your Minimum Detectable Effect (MDE).
- Rule 2: Run for Full Business Cycles: Regardless of how quickly data thresholds are met, a test must run for a minimum of two full weeks. This is crucial for smoothing out the performance variations that naturally occur between weekdays and weekends. For businesses with longer consideration cycles (e.g., high-ticket B2B services), running the test for at least four full weeks is highly recommended to capture a complete picture of user behavior.
- Rule 3: Beware the “Peeking” Fallacy: Do not stop a test early. A common, fatal error is monitoring a test daily and declaring a winner the exact moment the results appear to hit statistical significance. This practice, known as “peeking,” drastically inflates the risk of a false positive. An ad that appears to be a runaway winner on day three can easily be losing by day 14 due to regression to the mean. Let the test run its pre-determined course.
A test that does not produce a winning variation is not a failure; it is hard data.
Step Six: Conclude Tests & Iterate
The final step in the ad testing process once you’ve determined that you have a statistically significant test outcome is to turn your output into a concrete business action. To eliminate subjective interpretation and emotional bias, we rely on an unambiguous decision matrix.
Evaluate your results against a strict 95% confidence interval using the following protocol:
| Confidence Level | Lift vs. Control | Verdict & Action |
|---|---|---|
| < 95% | Positive Lift (> 0%) | Inconclusive (Positive Trend): The test did not prove a statistically significant difference. Do not declare a winner. Revert to the control ad and formulate a new hypothesis. |
| ≥ 95% | Positive Lift (> 0%) | Statistically Significant Winner: Declare the variant the winner. Pause the control ad and implement the winning variation. |
| < 95% | Negative Lift (≤ 0%) | Inconclusive (Negative Trend): The test did not prove a statistically significant difference. Do not declare a winner. Revert to the control ad and formulate a new hypothesis. |
| ≥ 95% | Negative Lift (≤ 0%) | Statistically Significant Loser: Declare the variant the loser. The control ad is the confirmed winner. Pause the variant ad permanently. |
Implementing the Winner and Scaling the Insight
If you were fortunate enough that your test concluded with a statistically significant winner via Google’s Experiments tool, simply use the “Apply” function to seamlessly roll the winning changes into the original testing group campaigns. If you ran a multi-pinned RSA, remove the losing assets. If a manual 2-RSA test, permanently pause the losing control ad.
However, implementing the winner is only half the job. The most crucial post-test activity is analyzing why it won. What was the core hypothesis? Did benefit-oriented language crush price-focused messaging? Did a direct call-to-action prove more effective than a curiosity gap?
This learning is the true prize of the experiment. Extract this insight and use it to form a new, broader macro-hypothesis that can be tested for a greater MDE or rolled out across other testing groups, creating a ripple effect of account-wide improvement.

We Either Win, Or We Learn, and Learning is Winning
A test that does not produce a winning variation is not a failure; it is hard data.
- Inconclusive Results: If the confidence level is below 95%, the tested variable did not have a strong enough impact on user behavior to rise above random noise. The takeaway? Tepid, minor changes (like swapping a single adjective) rarely move the needle. Pause the variant, consolidate your data, and formulate a much bolder hypothesis.
- Statistically Significant Losers: A confirmed loser is incredibly valuable. It provides a data-backed barricade that prevents you from making the costly mistake of scaling ineffective messaging to a wider audience. It narrows the field for future hypotheses.
Document Everything
Finally, document the results, the confidence level, and the key psychological learnings in your Ad Testing Workbook. This transforms your ad management from a reactive, guessing-game chore into a compounding, scientific program for predictable growth.
Additional Ad Testing Best Practices and Recommendations
To wrap things up, here are a handful of recommendations that I’ve found helpful when conducting my ad testing:
- It may be helpful to organize all campaigns in a testing group within a Campaign Group or View in the Google Ads UI
- Aggressively limit the number of assets in play to speed up ad tests
- Note that unpinned headlines beyond H3 may be utilized by Google’s Automated Assets infrastructure to generate dynamic sitelinks or inline descriptions, further muddying your data. Pin strictly to maintain control
- Label ads with the date of last change using format: YYYY-MM-DD
Work with Augmentiq
Need Expert Help Managing Your PPC Campaigns?
Ad testing is a rigorous, ongoing commitment that requires both scientific discipline and deep psychological insight. If the process of defining testing groups, calculating statistical significance, or managing campaign structures feels overwhelming, you don’t have to navigate it alone.
At Augmentiq, we specialize in transforming ad management from a guessing game into a predictable engine for growth. Whether you are looking to audit your existing setup, design your first rigorous ad test, or require comprehensive PPC campaign management, our team is ready to help you drive better results.
Click here to contact Augmentiq and discover how we can help you turn your ad spend into your most valuable asset.
Which Testing Method Is Your Account Living With Today?
Experiments tab, multi-pinned RSA, two-RSA rotation, or the dirty-and-dangerous unpinned assetmaxx? Tell me which one you’re running, how many conversions your biggest testing group produces in a month, and the last test question you actually got an answer to. I read every comment and reply to the good ones.
Still designing your first test? Grab the Psychological Drivers quickref for twenty appeals worth testing.